Chapter 4. Climate Change

Changing Climate Continues to Pose Threats to the Ecology, Economy, and Community of the Bay

Extreme Weather Events Remain a Major Concern with More Days Receiving Over an Inch of Precipitation

At a Glance

Casco Bay is experiencing warmer winters on average, but summer temperatures have not changed significantly.

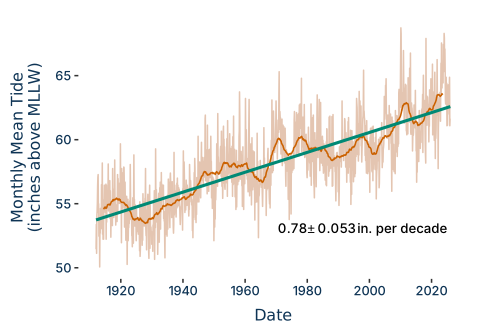
The average sea level has increased about 9 inches since the 1910s.

More frequent and extreme storms have been observed with 13 days receiving greater than one inch of precipitation in 2024.

Climate change continues to threaten our communities while also impacting tourism and the economy.

Since the 2021 Report

Trends reported in 2020 have largely continued. Days with cold temperatures and annual snowfall continue to decrease, while extreme precipitation events, growing season length, and sea level continue to increase. The January 2024 storms caused substantial damage to coastal infrastructure, including the iconic fishing shacks at Willard Beach, and have brought new attention to the impacts of climate change on coastal communities. These recent events are inspiring conversations on how to adapt to these changes and demonstrating the resilience of coastal communities and ecosystems.

The changing climate is impacting the people, infrastructure, water, and habitats of Casco Bay. As winters continue to warm the growing season is longer, changing the timing of when pollinators, herbivores, and even humans interact with the plants they rely on for food.

Habitat ranges of both aquatic and terrestrial organisms are shifting, changing the availability of food and fishery resources for predators and people. More frequent storms and rising sea levels pose threats to coastal communities, creating a need for more extensive municipal planning, expensive infrastructure upgrades, and urgency for climate resilience funding.
Warmer Winters

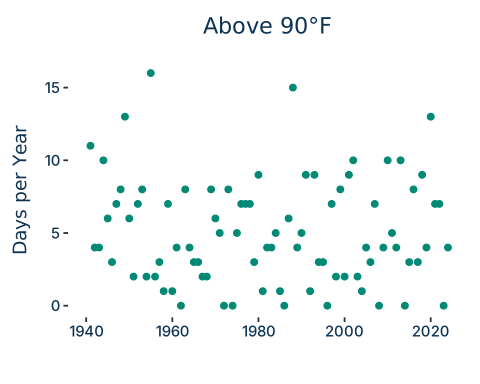
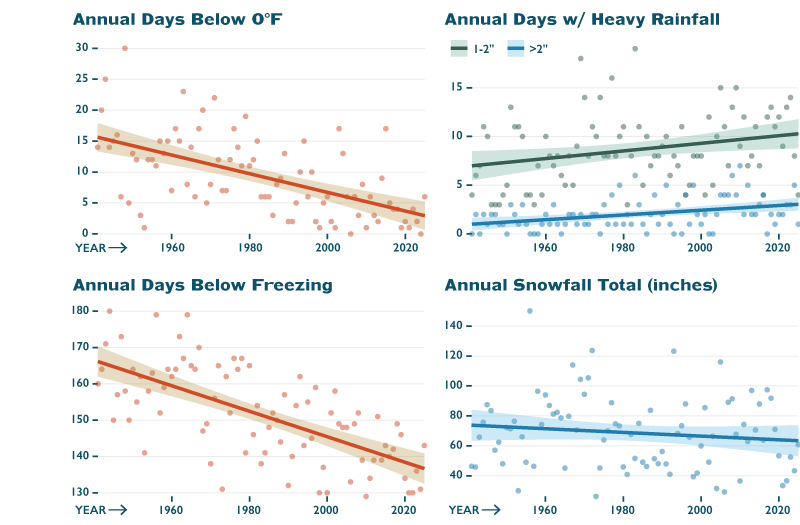
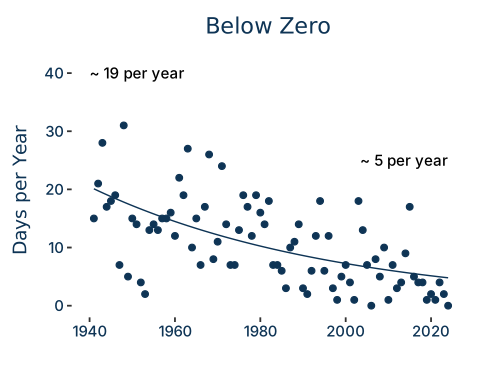
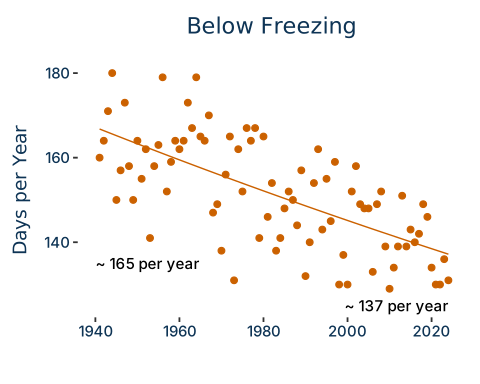
Figure 1. The days per year below zero, below freezing, and above 90 degrees Fahrenheit.


A weather monitoring station set up at the Portland Jetport in 1940 provides a long-term record of weather data in Casco Bay. Analysis of data from this station shows that Casco Bay is experiencing warmer winters, with a two week decrease in the number of days below 0°F and a three week decrease in the number of days below freezing (32°F) since 1940.

Longer Growing Season

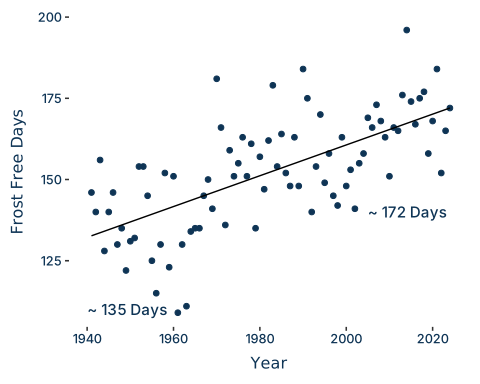
The number of hot days in summer (above 90°F) has not increased since 1940, with a consistent average of 5 days per year. The growing season, or number of frost-free days, has increased because of warming winters from about 135 days in 1940 to 172 days in 2020. This means frost free days account for nearly half of the year.

Figure 2. The growing season and number of frost-free days since 1940.

Less Snow, More Extreme Precipitation

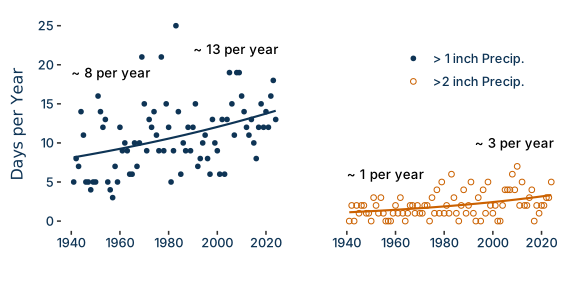
Figure 3. Days with Extreme Precipitation over 1 inch and over 2 inches.

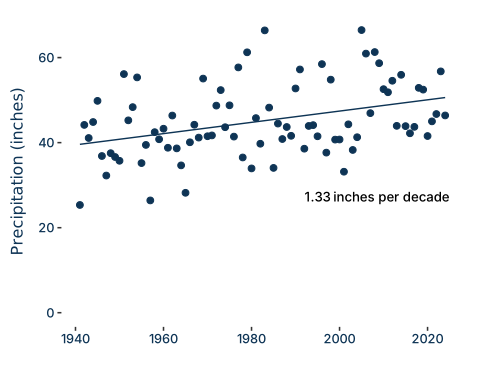
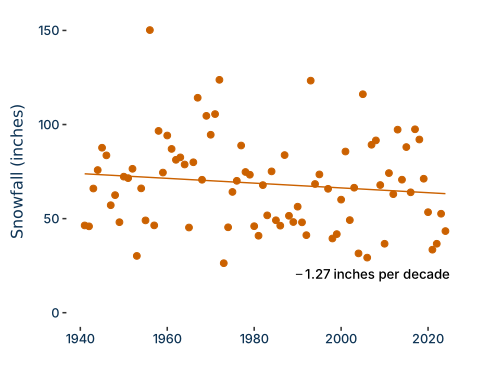
Figure 4. Rainfall and snowfall annual totals since 1940.


Snowfall annual totals have decreased about 1.27 inches per decade since 1940, while total annual precipitation has increased by 1.33 inches per decade. Precipitation is also more frequently occurring as severe storms that deliver large amounts of precipitation in a short time as opposed to more frequent smaller precipitation events.

In 2024, 13 days received over one inch of precipitation and 3 days were recorded having over two inches of precipitation. In comparison, in 1940, there were just 9 days of extreme precipitation, with 8 days receiving over one inch and one day with over two inches.

Less snow and ice could mean a drop in winter ecotourism, impacting Maine’s skiing, snowmobiling, and winter hiking industries. Extreme weather creates unsafe conditions for people exploring Maine during the warmer months.

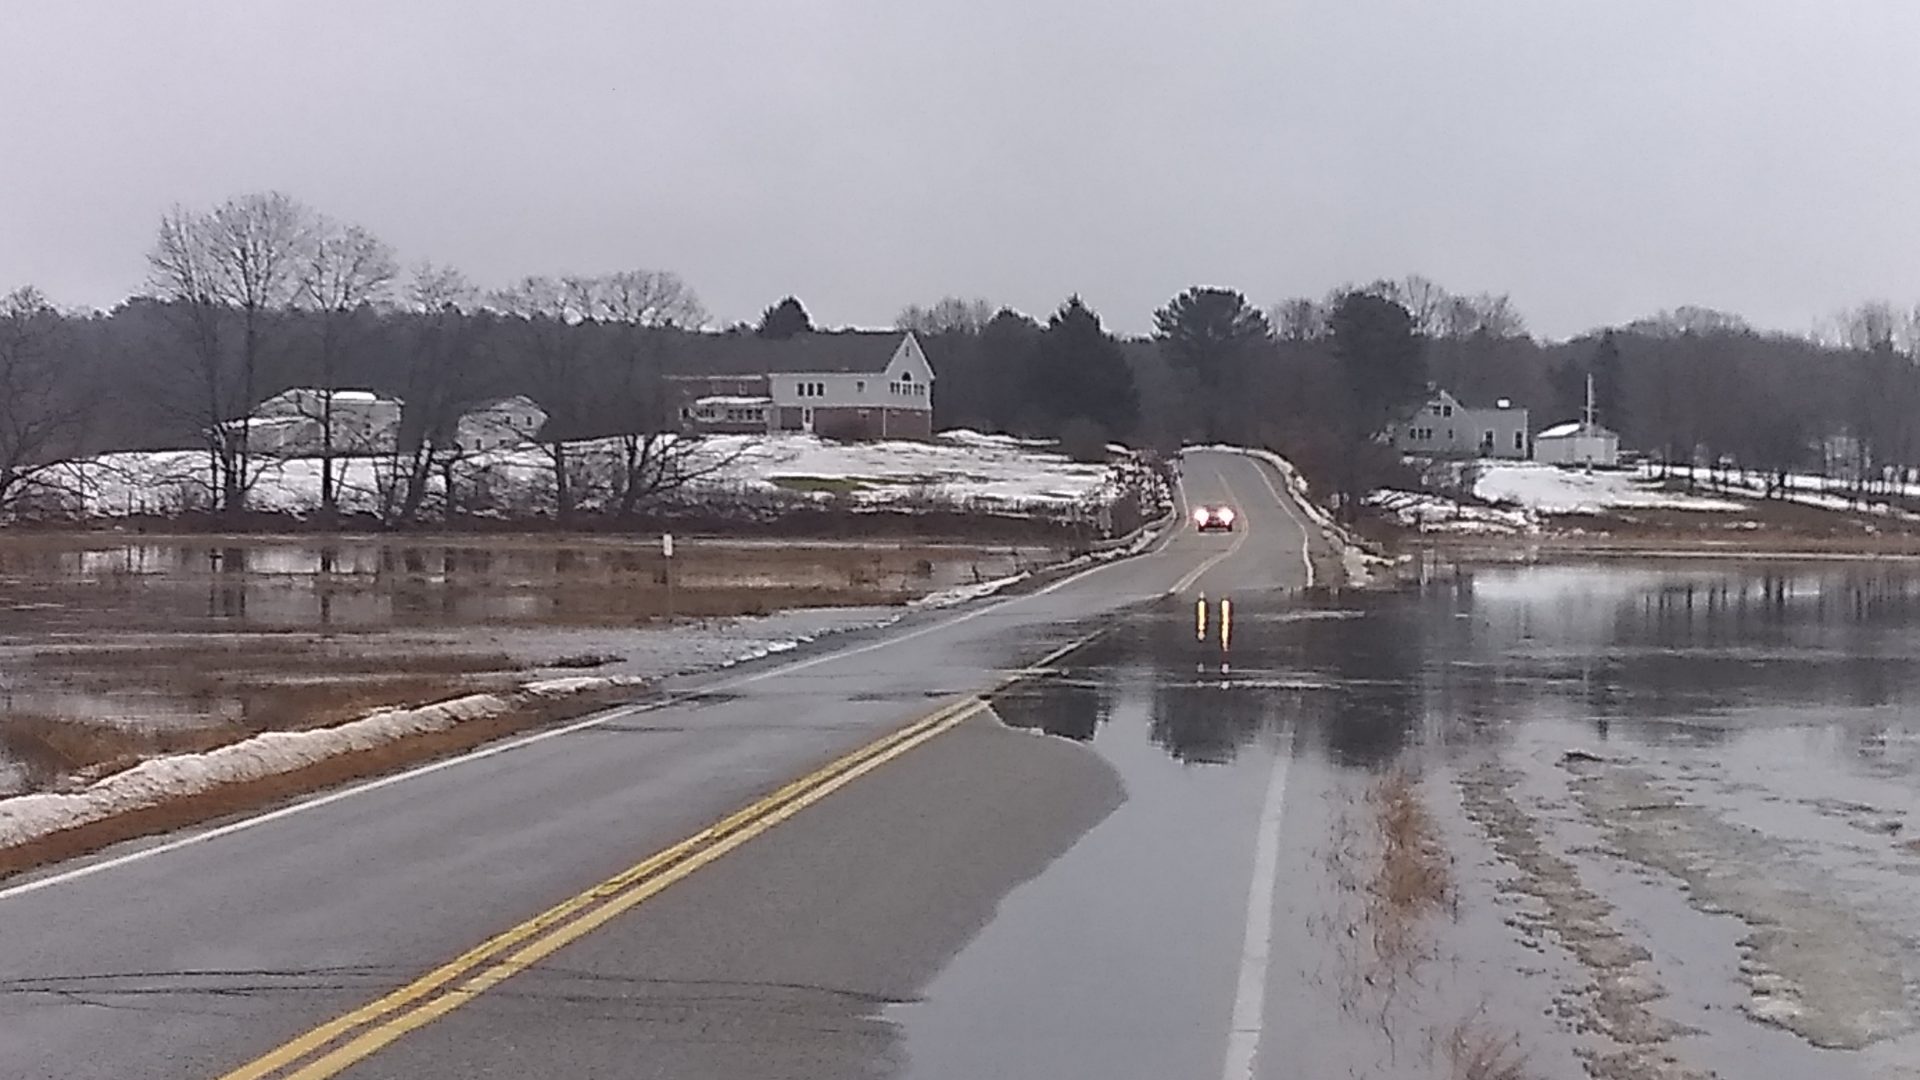
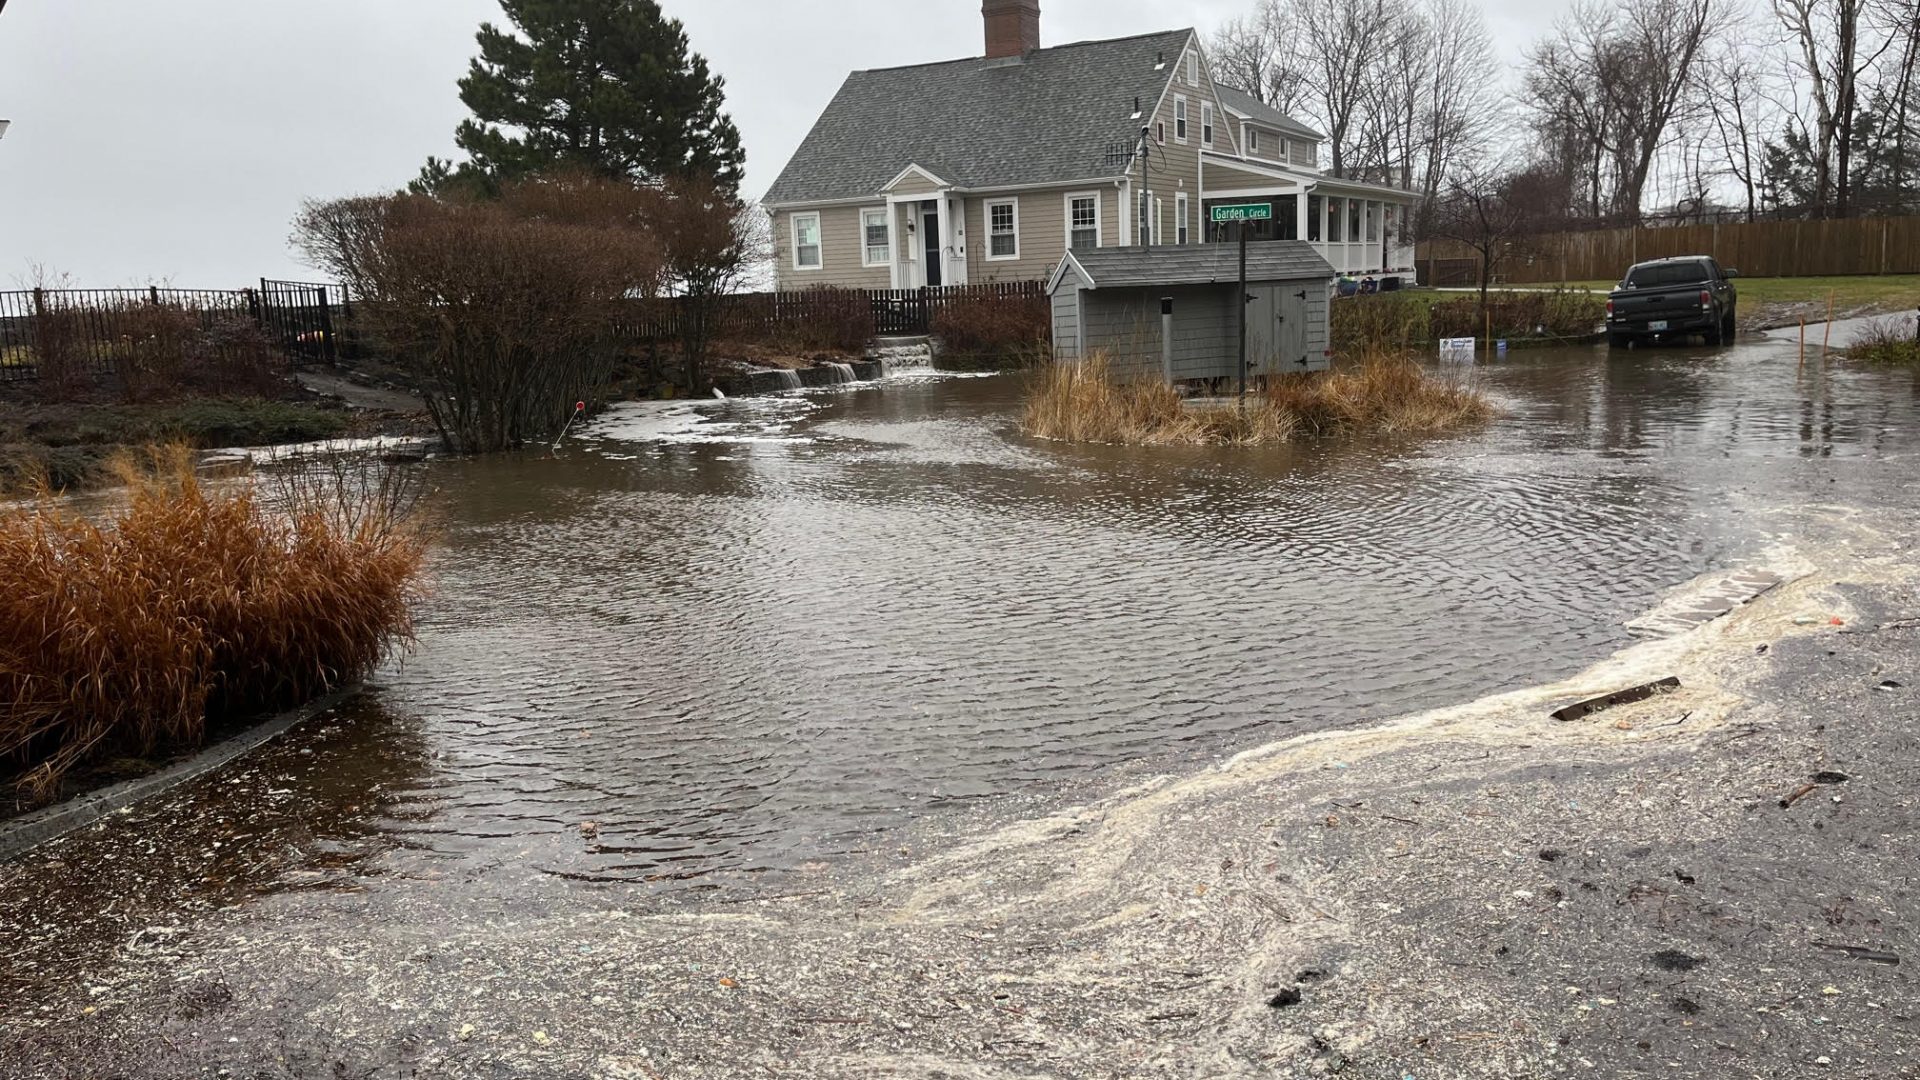
Sawyer Road, Cape Elizabeth | Image: CBEP

Sebago Lake Ice Out Dates

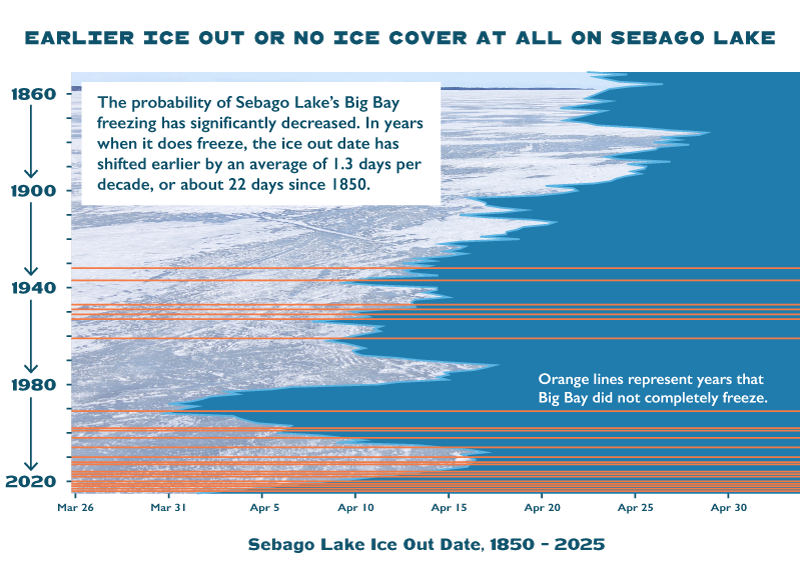
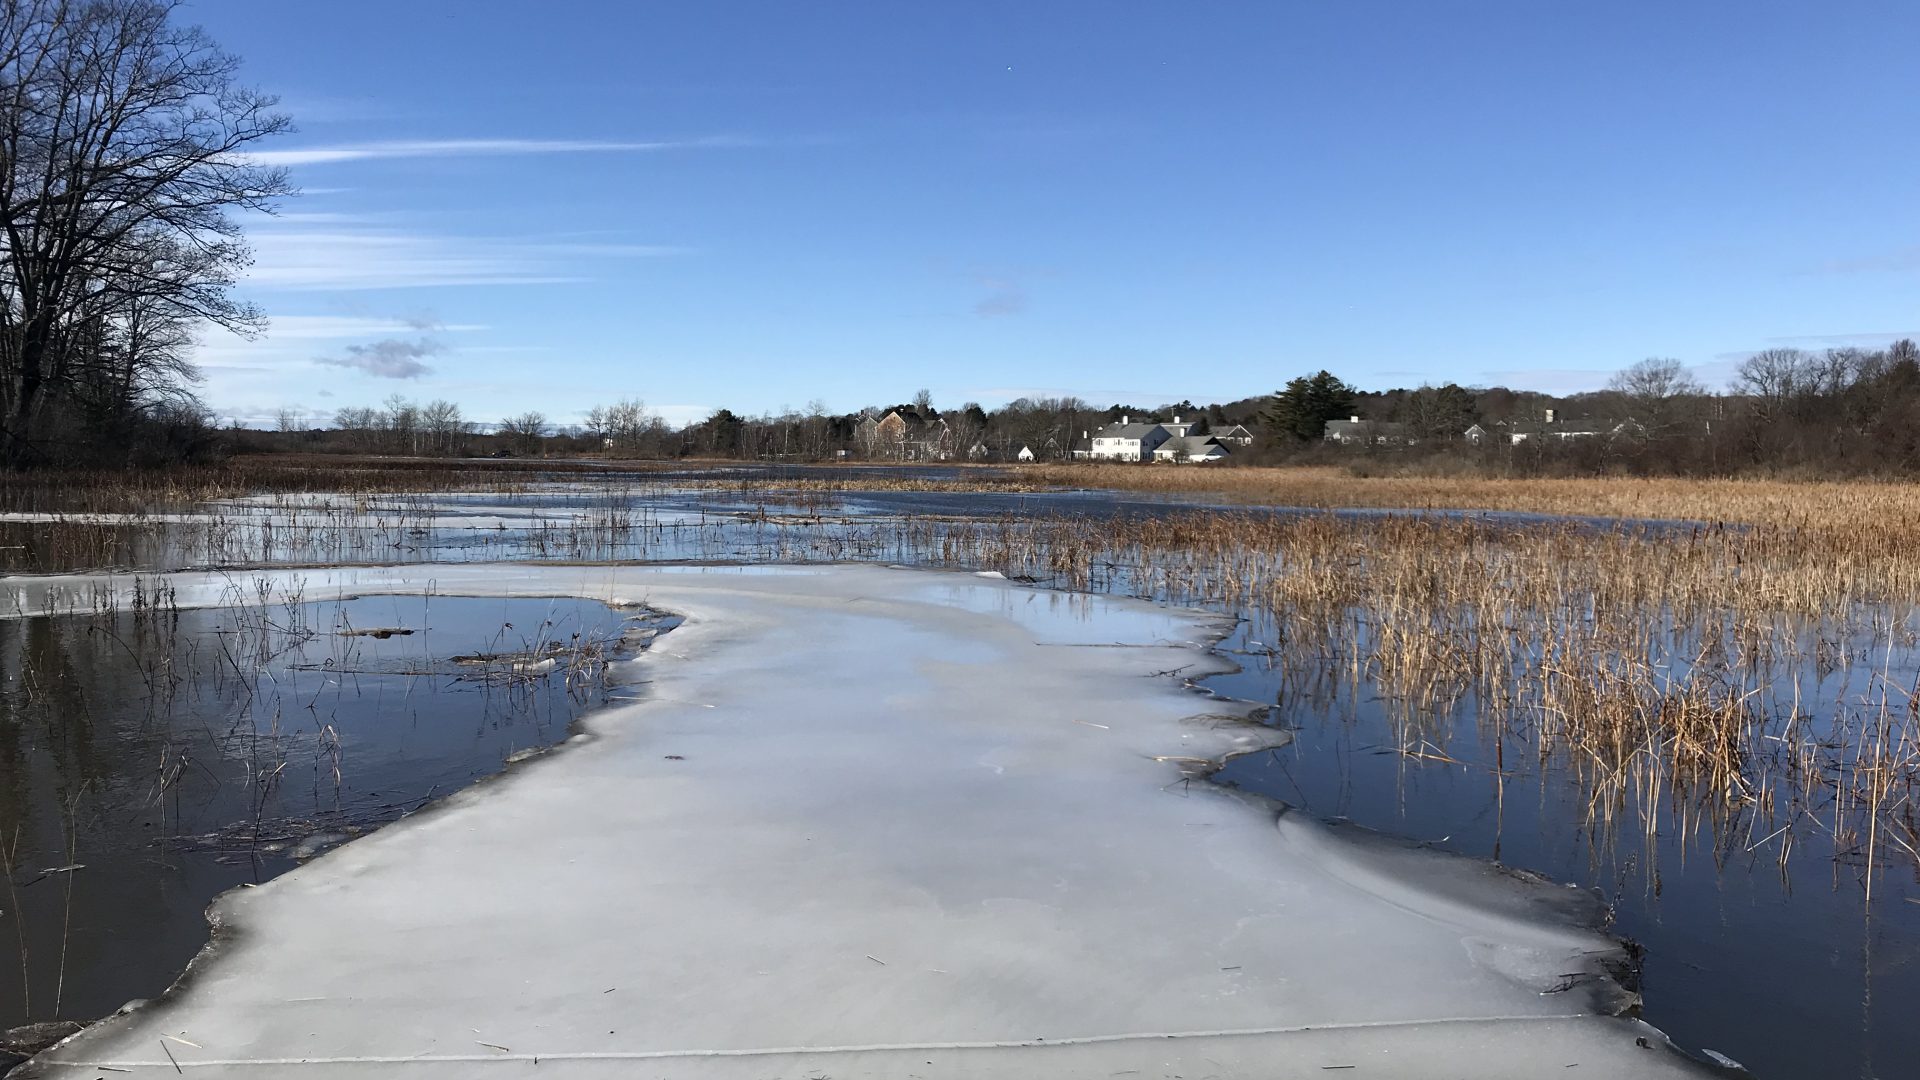
Portland Water District (PWD) measures annual ice out dates, or when a lake becomes navigable or almost entirely ice-free, in the Big Bay of Sebago Lake.

The dataset has ice out dates stretching back over two centuries to 1807, although records are spotty in early years. Big Bay froze consistently from 1812 to the late 1990s, except for seven years during a brief warming period in the mid-1900s. The probability of Big Bay freezing has significantly decreased, and Big Bay has not had complete ice cover in 10 of the last 15 years. In years when it does freeze, the ice out date has gotten earlier by an average of 1.7 days per decade, or about 37 days over the 218-year period of record.

This trend of earlier ice out or no ice cover at all interferes with both the winter ecology and recreational activities (ice fishing, skating, etc.) on Sebago Lake.

Ch. 7 Portland Water District 2022
Portland, 2022 | Image: CBEP

Sea Level Rise Remains a Concern in the Bay

Figure 5. Sea Level Rise at Portland Harbor.


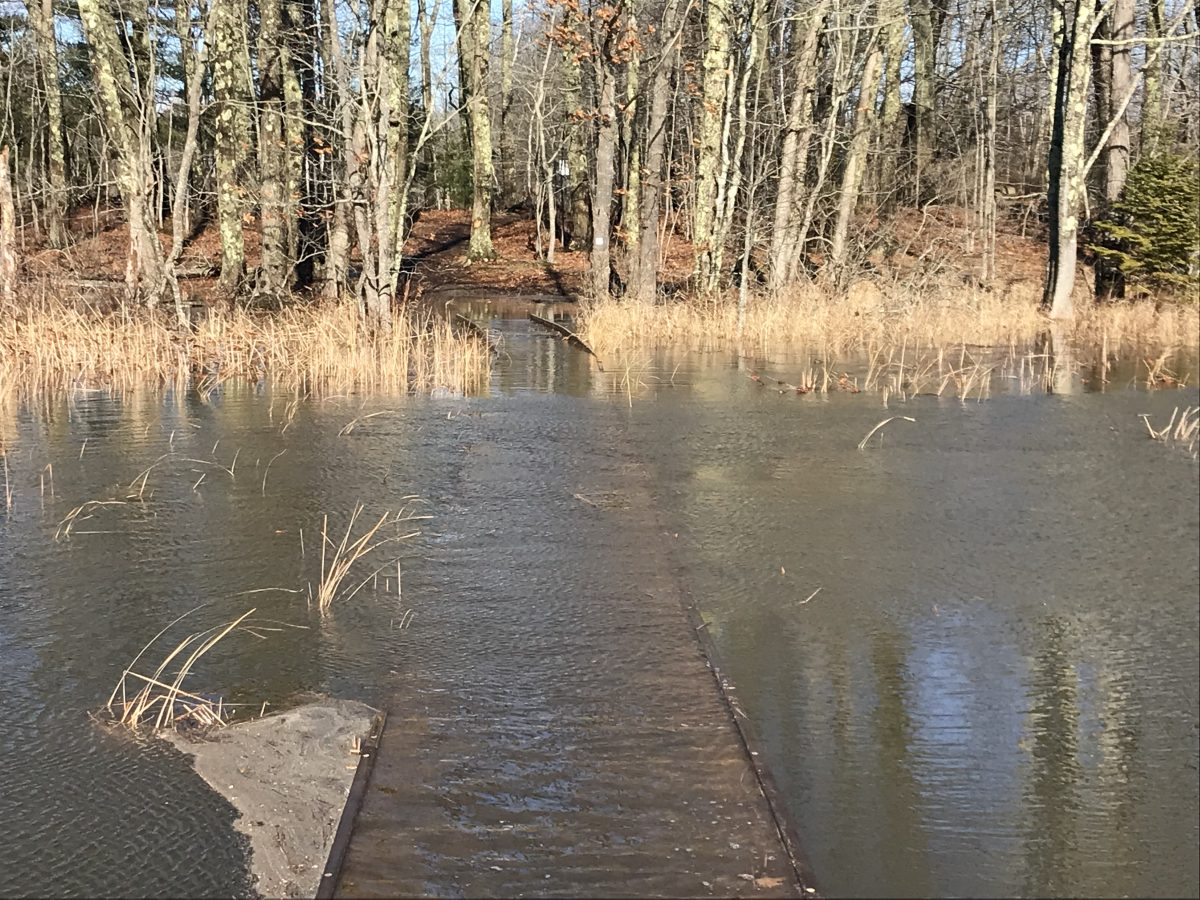
While sea level is naturally variable with alternating multi-year cycles of increases and declines, the average sea level has increased about 9 inches since the 1910s. South Portland’s iconic fishing shacks near Willard Beach were destroyed during one of the January 2024 storms when storm surge and a king tide combined to create a record high tide (14.57 feet). The loss of these historic buildings garnered national attention, but is merely a representation of the significant damage to Maine’s coastal infrastructure and working waterfront communities caused by the storms.  The January 2024 storms were an eye-opening event for coastal communities and demonstrated a serious need for resilient shorefronts.

Ch. 7 CBEP 2024 event 3
Image: CBEP

CLIMATE ACTION PLAN

Maine Won’t Wait, Maine’s climate action plan, was published by the Maine Climate Council in 2020. The plan is chaired by representatives from the Governor’s Office of Policy Innovation and the Future as well as the Maine Department of Environmental Protection. The plan was updated in 2024 and identifies strengthening resilience to extreme weather as a main focus (see Climate Preparedness Chapter).

Looking Ahead to 2030

Incidents such as losing the historic Willard Beach fishing shacks to the January 2024 storms make the threats of climate change more apparent to people. As the sea level rises, extreme storms become more frequent, winters get warmer, and the growing season becomes longer, communities are struggling to respond. Extensive municipal planning, expensive infrastructure upgrades, and climate resilience funding are all necessary as we enter an uncertain future.

Ch. 7 CBEP 2024 event
Image: CBEP