Chapter 7. Bay Water Quality and Coastal Acidification

Continuous Monitoring Shows Us How Casco Bay Flows and Breathes

Seasonal Patterns in Water Quality Differ By Location

At a Glance

We can see Casco Bay breathing. Oxygen levels reflect the balance between photosynthesis and respiration and reveal daily and seasonal biological activity of the bay.

A substantial fraction of many pollutants that enter Casco Bay flow into Portland Harbor from urban runoff, combined sewer overflows, atmospheric deposition and wastewater treatment facilities. Yet water quality in the harbor is often good, as it’s protected by strong tides bringing in clean water.

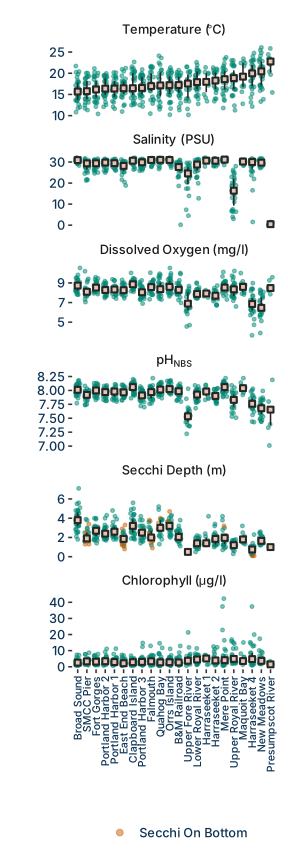
Enclosed or semi-enclosed inshore areas with less mixing (like the upper Fore River, the Presumpscot Estuary, the Harraseeket, and the New Meadows) are more vulnerable to water quality issues. These areas tend to have shallow, warm water, and show lower water clarity and dissolved oxygen than other areas of the Bay.

Casco Bay temperatures continue to be higher than historical averages, especially in spring and fall.

Omega aragonite, an indicator of acidification, often dips to levels that may stress shellfish, especially in winter and early spring.

Since the 2021 Report

Friends of Casco Bay (FOCB) has two new continuous monitoring stations that collect data every 15 minutes and give us a more accurate snapshot of daily and seasonal Bay water quality trends. They now have three stations in total, which are producing a huge amount of data and allowing us to detect previously hidden patterns.

Casco Bay is a complex and dynamic system. Water flows in the Bay are shaped by tides bringing in water from offshore, freshwater from local tributaries, and the plume of the Kennebec River. The many islands, bays, and coves trap water in some areas while allowing it to flow quickly through others. Water temperature, dissolved oxygen, salinity, pH, and other water quality parameters are heavily influenced by water flow, so by monitoring water quality, more insight into how water is moving through the Bay is gained.

Water quality influences many of the ways people interact with the Bay (swimming, shellfish harvesting, fishing, etc.), so understanding the links between water quality and flow helps us predict what areas will be most at risk to stressors and pollution, and how that might impact community interactions with the bay.
FOCB’s Monitoring Stations Offer Continuous Data

Friends of Casco Bay (FOCB) established Continuous Monitoring Stations in Yarmouth in 2016 and in Harpswell and Portland Harbor in 2021. Each station has a data sonde that measures salinity, dissolved oxygen, dissolved oxygen percent saturation, chlorophyll, pH, and turbidity every 15 minutes. Partial pressure of carbon dioxide,total alkalinity, dissolved inorganic carbon and omega aragonite are also calculated from the measured data. This high-frequency monitoring is providing new insights into how Casco Bay responds to stressors and is changing with the climate. The locations of the three stations are helping us understand variability across the Bay and the environmental drivers that are affecting conditions in each region.

FOCB’s continuous monitoring efforts and sharing of their data have been instrumental in moving forward our understanding of the dynamics of Casco Bay.


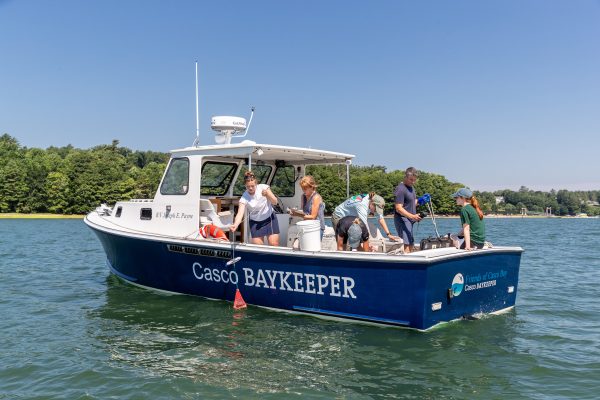
Friends of Casco Bay water sampling and eelgrass research (Image: Kevin Morris)

Casco Bay is Breathing

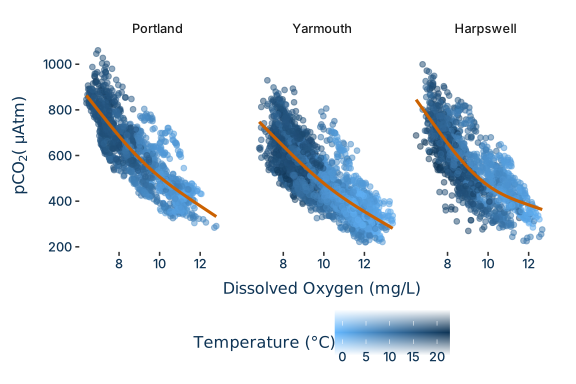
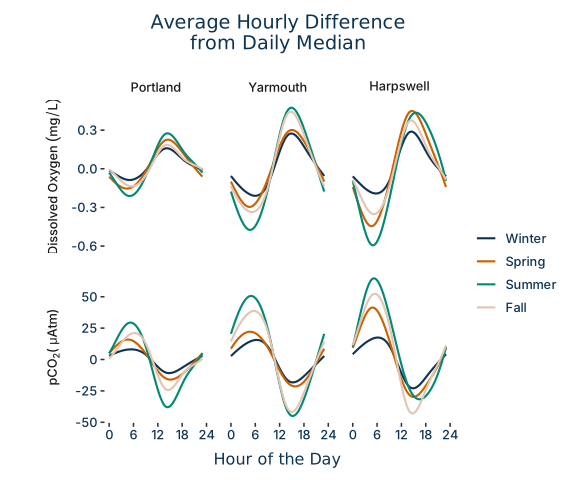
Concentrations of oxygen and carbon dioxide in water are measured as dissolved oxygen (DO) and partial pressure of CO2 (pCO2). There is a clear inverse relationship between pCO2 and DO with daily and seasonal patterns that show us the biological activity – the breath – of Casco Bay.

Respiration is a cellular process by which all living things make energy. As part of respiration, organisms take in oxygen and release carbon dioxide. Plants and algae couple respiration with photosynthesis, where they take in carbon dioxide and release oxygen. Photosynthesis only occurs during daylight hours when sun is available, during these hours DO in the waters of the Bay increases, while pCO2 declines.

From the evening to the early morning, pCO2 increases and DO declines as photosynthesis stops and respiration continues. This diurnal pattern is most obvious in the summer and is suppressed in the winter when cold water temperatures slow metabolisms, reducing plant/algal growth (which requires photosynthesis) and bacterial decomposition (which requires respiration). Both the seasonal and daily patterns are strongest at the Harpswell site and weakest in Portland. All together this shows us when and where biological activity in the Bay is highest.

Figure 1. Statistical analysis of daily changes in oxygen and carbon dioxide in Casco Bay reveal daily cycles as the organisms in the Bay consume and release oxygen through respiration and photosynthesis.  Larger swings – not regularly observed in Casco Bay – could offer an early sign of water quality problems.

Figure 2. Oxygen and carbon dioxide are linked by the bay’s biology.  When oxygen increases, carbon dioxide tends to go down. Higher dissolved oxygen, lower carbon dioxide conditions typically occur at cooler water temperatures in the winter.


Hydrodynamics of Casco Bay

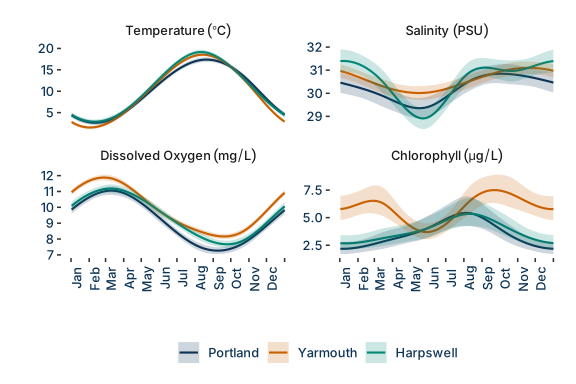
Figure 3. Seasonal temperature, salinity, DO, and chlorophyll patterns from all three monitoring stations.

FOCB’s three continuous stations provide information that tells us how water flows between them and the rest of Casco Bay. Water from offshore is typically cool with high concentrations of dissolved oxygen, while freshwater entering the Bay from streams is generally warmer and lowers the salinity of the water it mixes with. These influences can be seen at the three stations.

Portland displays the lowest temperatures out of the three sites. Portland Harbor is connected to ocean waters because of the strong tides flowing into the harbor from past Portland Head Light.  Harpswell is influenced by the Kennebec River plume, which leads to a spring influx of fresh water in the eastern Bay and a seasonal drop in salinity levels. Yarmouth is the most variable site. It is sheltered by islands and has more limited exchange with offshore waters. Therefore, Yarmouth’s water quality is more influenced by local conditions.

Complex Carbonate Systems

pH, pCO2, dissolved inorganic carbon (DIC), total alkalinity (TA), and omega aragonite (ΩA) are all measurements of parts of the complex ocean carbonate system. The balance of this system dictates how hard it is for shell-forming organisms (including oysters, clams, mussels, crabs, and lobsters) to build their shells.

Carbon dioxide does diffuse back and forth between Casco Bay and the atmosphere, but much of the carbon in the Bay actually comes from watershed inputs, which carry carbon produced on land into the Bay through tributaries and runoff. This has three important implications for the bay: 1) this excess carbon goes back to the atmosphere, meaning Casco Bay adds more CO2 to the atmosphere than it absorbs and is a net source of carbon, 2) increasing CO2 in the atmosphere will make it harder for this excess carbon to diffuse out, so more CO2 will stay in the waters of the bay, and 3) the carbonate system and acidification of coastal waters is being driven by what’s happening in the watershed, rather than just in the atmosphere.

Coastal Acidification

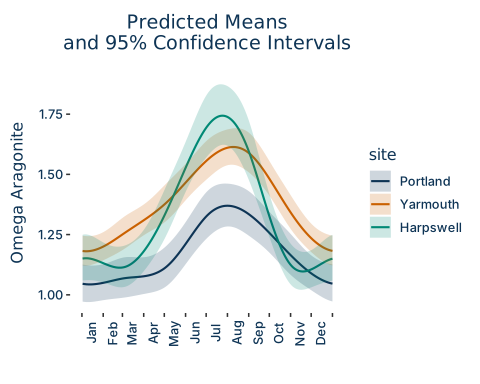
Omega aragonite (ΩA) can tell us how suitable the water conditions are for shellfish by predicting how easy it will be for them to form shells. Aragonite is a calcium carbonate mineral and an important building block of shells. ΩA measures how saturated the water is with aragonite, and when it is low (below 1.0) in the water, shells can start to dissolve. Consequently, ΩA is a biologically-relevant indicator of acidification. Negative effects on some marine species have been documented at ΩA levels below 1.5, and juvenile and larval shellfish often require even higher levels of ΩA to support growth.

ΩA is highest in the summer months, particularly in June, July, and August. While ΩA does not typically dip below 1.0, it is frequently below 1.5, where shellfish species could be harmed. Because there is limited historic information on ΩA in Casco Bay, it is not yet clear how big a problem this is.

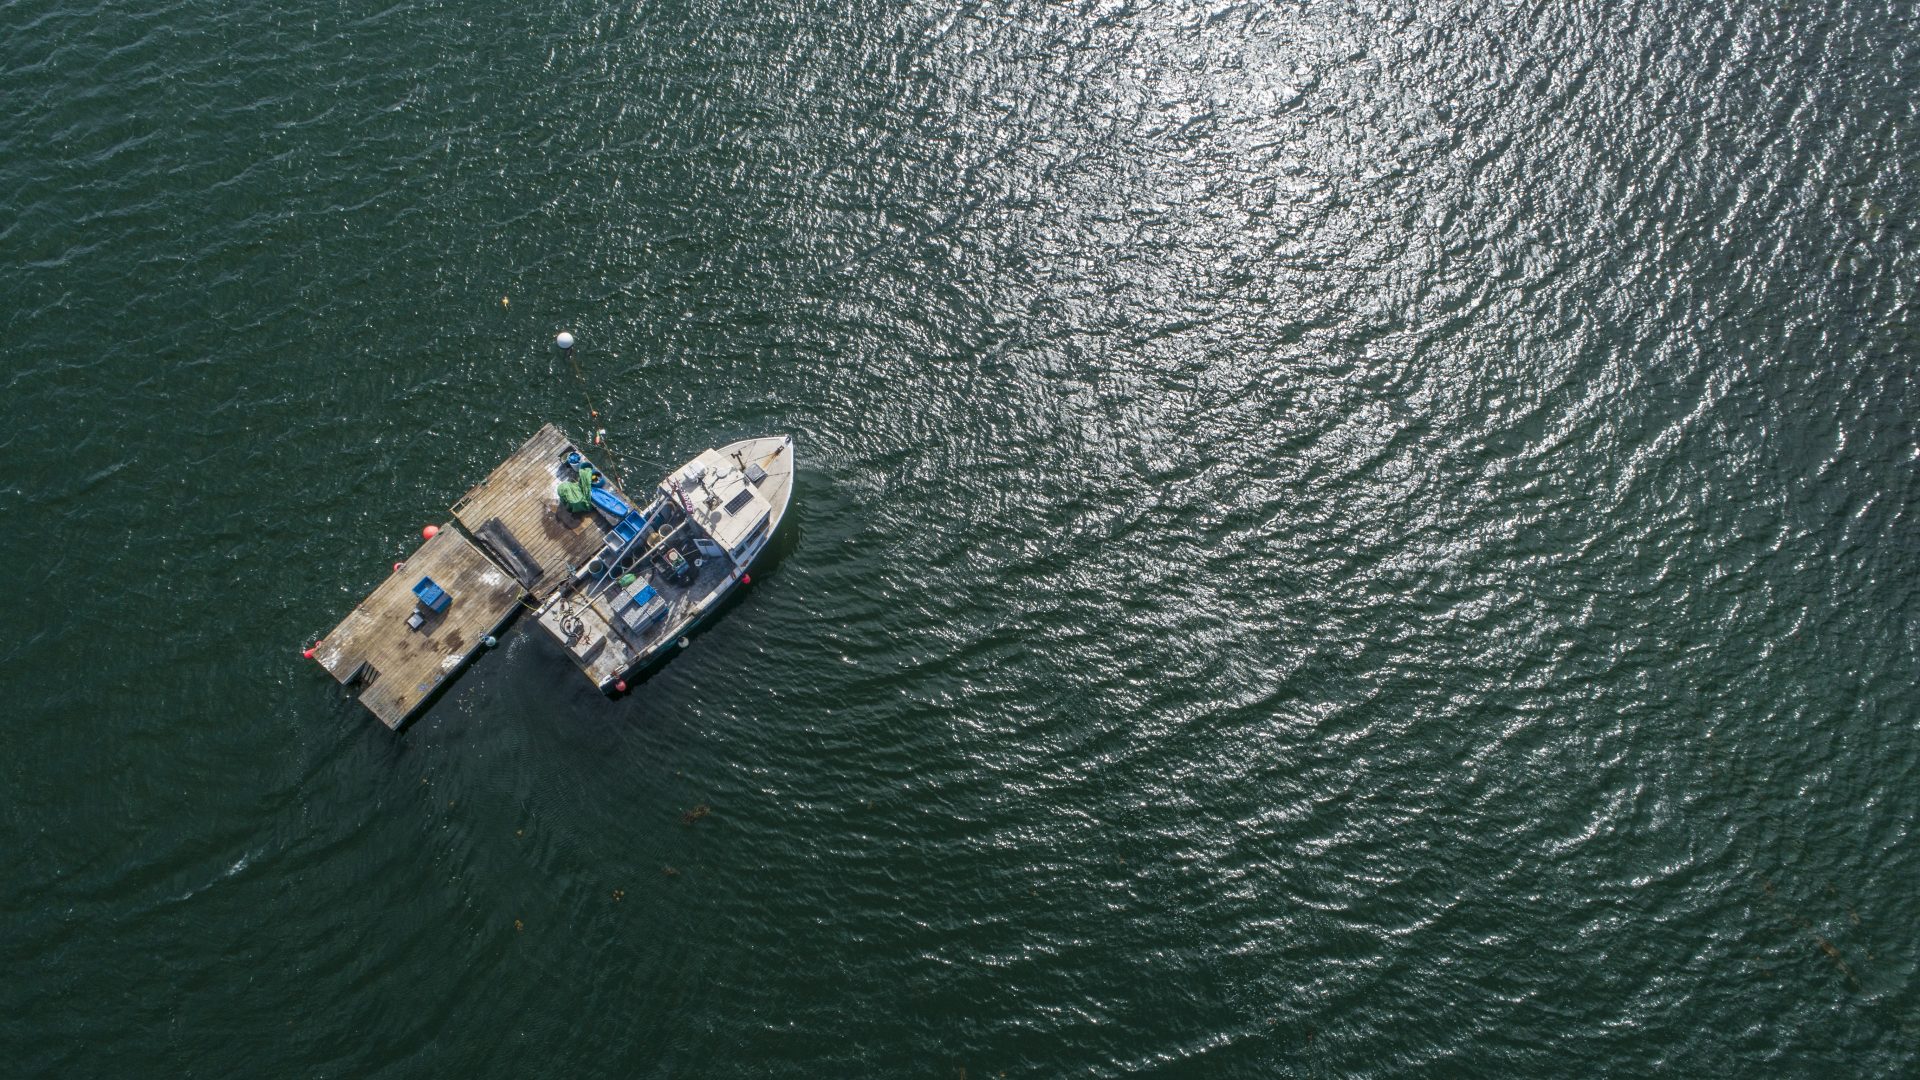
A lobster boat anchored off of Little Chebeague Island in Casco Bay, Portland, Maine. (Image: Jerry Monkman)
A lobster boat anchored off of Little Chebeague Island in Casco Bay, Portland, Maine.

Water Quality Status

Bay water quality is strongly influenced by the movement of water. Temperature and salinity provide evidence for how water moves, and so can help us evaluate where waters are most at risk.

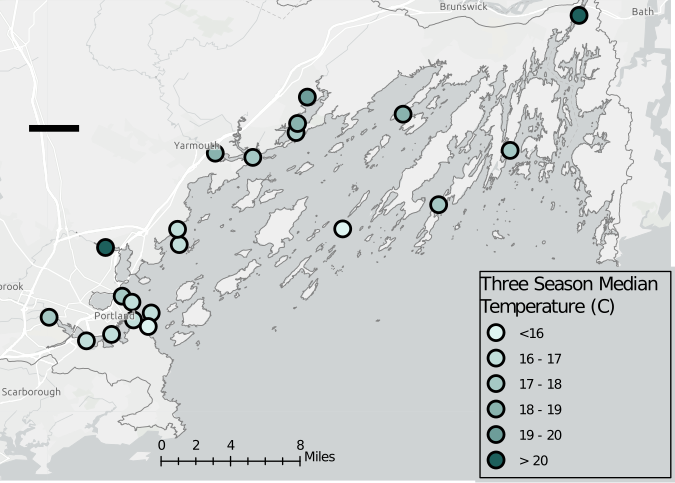
In the warmer months of the year, offshore waters tend to be cooler than those closer to shore, while water that enters the Bay from the tributaries tends to be warmer.  Semi-enclosed inland waters also tend to be shallow, and so more prone to warming on hot summer days.

Offshore sites – and sites in like those around Portland Harbor that are linked to offshore waters by strong tides – tend to have

  • Cooler water
  • Higher dissolved oxygen,
  • Clearer water (higher Secchi depth)
  • Lower chlorophyll levels

Sites influenced by freshwater inflows to the Bay tend to have

  • Lower salinity
  • Lower dissolved oxygen
  • Lower pH
  • Lower water clarity (lower Secchi depth)

The Bay’s semi-enclosed bays and estuaries, such as the upper Fore River, the Presumpscot Estuary, the Royal River Estuary, the Harraseeket and the New Meadows are likely to be especially vulnerable to pollution. Each of these areas is enclosed or semi-enclosed, limiting exchange with offshore waters, and also influenced by freshwater entering the Bay.

Figure 4. Median three-season (April through October) water temperatures reveal the degree to which different parts of the Bay are linked to offshore waters. Enclosed bays and estuaries, like the Presumpscot, Royal, Harraseeket and New Meadows are warmer than waters that mix freely with cooler offshore waters. 

Water Quality Trends

FOCB has tracked water quality in the Bay for more than thirty years, collecting data from April through October. A total of sixteen sites have accumulated enough data to support analysis of long-term trends.

While each site has its own story to tell, by combining data from all sixteen sites, bay-wide trends in water quality can be evaluated.

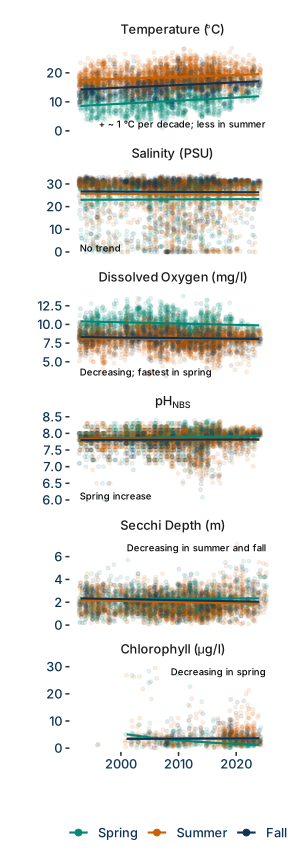
Overall, water temperatures are increasing at fifteen of sixteen sites. Temperature increases have averaged about one degree Celsius per decade in spring (April and May) and fall (September and October). Water temperatures have risen slightly more slowly in the summer months.

Dissolved oxygen levels have declined slightly over time, with declines observed at seven sites, and an increase observed at one. Warming waters contribute to this trend, since oxygen is less soluble in warmer waters.

Secchi depths, a measure of water clarity, have been decreasing on average Bay-wide in the summer and fall. Of the eleven sites with enough Secchi data for trend analysis, six show long-term declines in water clarity, while the other five show no clear changes.

Chlorophyll is a measure of the abundance of photosynthetic algae, called phytoplankton, in the Bay’s waters. Combining data across sixteen sites, it is observed that chlorophyll has been declining – but principally in the spring. Only three of sixteen sites show significant declines.

Looking Ahead to 2030

We look forward to growing long-term records from Friends of Casco Bay’s monitoring programs and are exploring opportunities to gather high frequency data from additional locations on the bay. Bowdoin College recently installed a continuous monitoring station at the Schiller Coastal Studies Center. Researchers, aquaculture operators and others have begun to deploy new, lower-cost technologies for measuring water quality.

A high resolution model of water movement in Casco Bay now provides daily three-day forecasts of salinity, temperature, currents, and waves. Combining data from automated sensors at multiple locations around the Bay with insights from models will drive improvement in models, observation, and understanding.

Casco Bay science is increasingly data rich, creating new opportunities, but also new challenges. The next State of Casco Bay report will rest as much on advances in regional collaboration, data curation, modeling and analytic methods as on expanded collection of water quality data.